Tracing
LangDB Gateway provides detailed tracing to monitor, debug, and optimize LLM workflows.
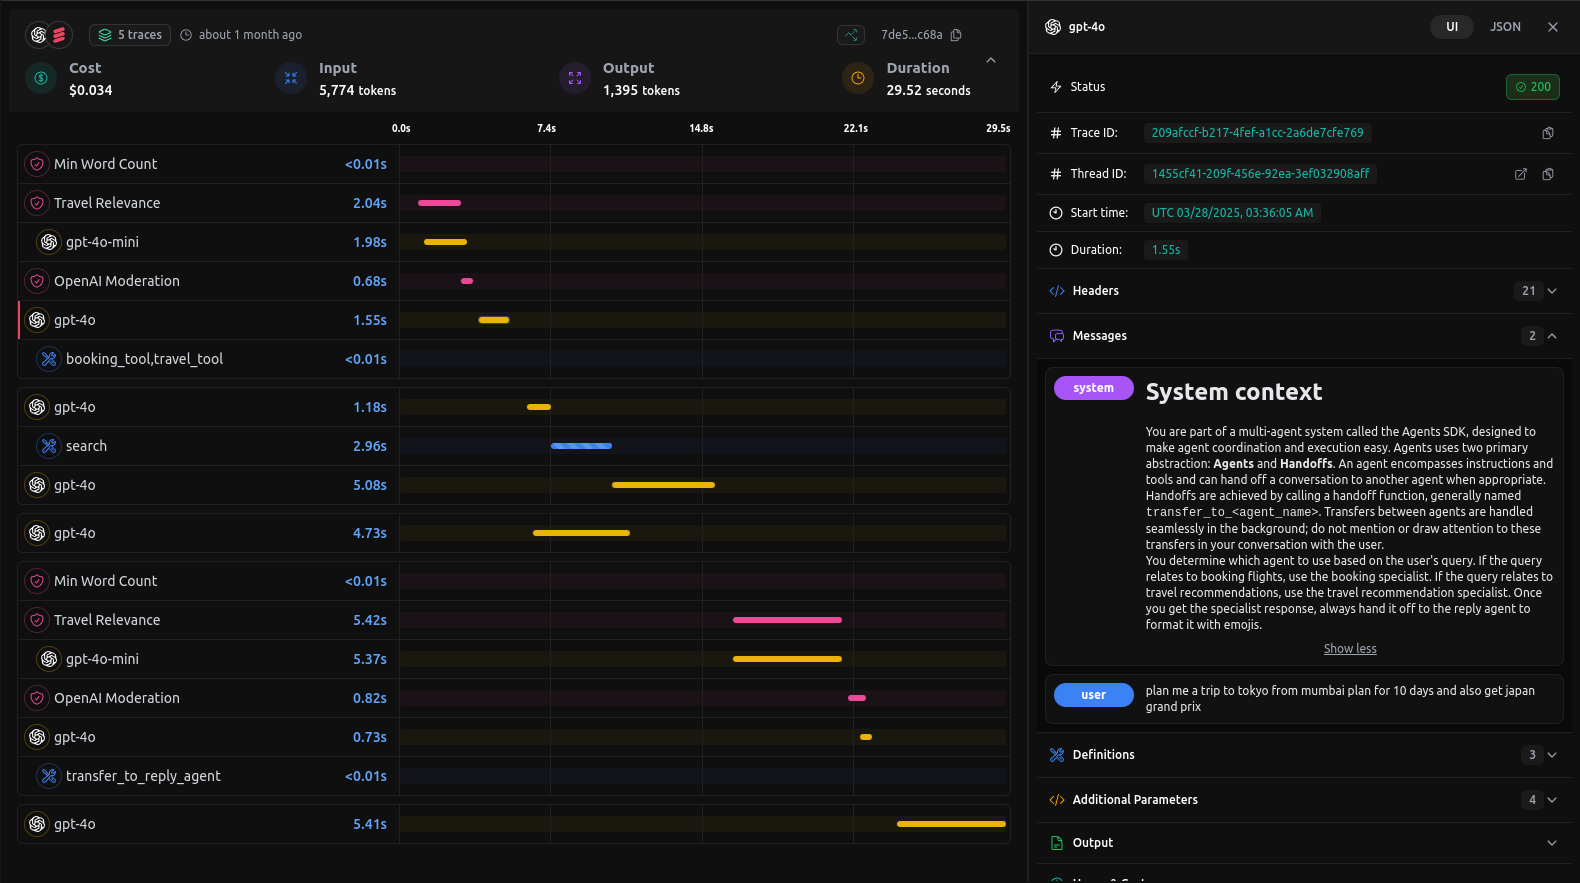
Below is an example of a trace visualization from the dashboard, showcasing a detailed breakdown of the request stages:
In this example trace you’ll find:
- Overview Metrics
- Cost: Total spend for this request (e.g. $0.034).
- Tokens: Input (5,774) vs. output (1,395).
- Duration: Total end-to-end latency (29.52 s).
- Timeline Breakdown
A parallel-track timeline showing each step—from moderation and relevance scoring to model inference and final reply. - Model Invocations**
Every call togpt-4o-mini,gpt-4o, etc., is plotted with precise start times and durations. - Agent Hand-offs
Transitions between your agents (e.g. search → booking → reply) are highlighted with custom labels liketransfer_to_reply_agent. - Tool Integrations
External tools (e.g.booking_tool,travel_tool,python_repl_tool) appear inline with their execution times—so you can spot slow or failed runs immediately. - Guardrails
Rules like Min Word Count and Travel Relevance enforce domain-specific constraints and appear in the trace.
With this level of visibility you can quickly pinpoint bottlenecks, understand cost drivers, and ensure your multi-agent pipelines run smoothly.